best of, air quality
Cities with the cleanest air, ranked by verified PM2.5
The WHO 2021 guideline puts the safe annual mean PM2.5 at 5 µg/m³. Anything above 35 µg/m³ counts as “Interim Target 1”, the floor for the most polluted countries. These figures are modelled, so coastal cities can read high against ground stations. Ranking within the list is sound; treat the absolute figure as modelled. Lower is better.
the ranking
- 01
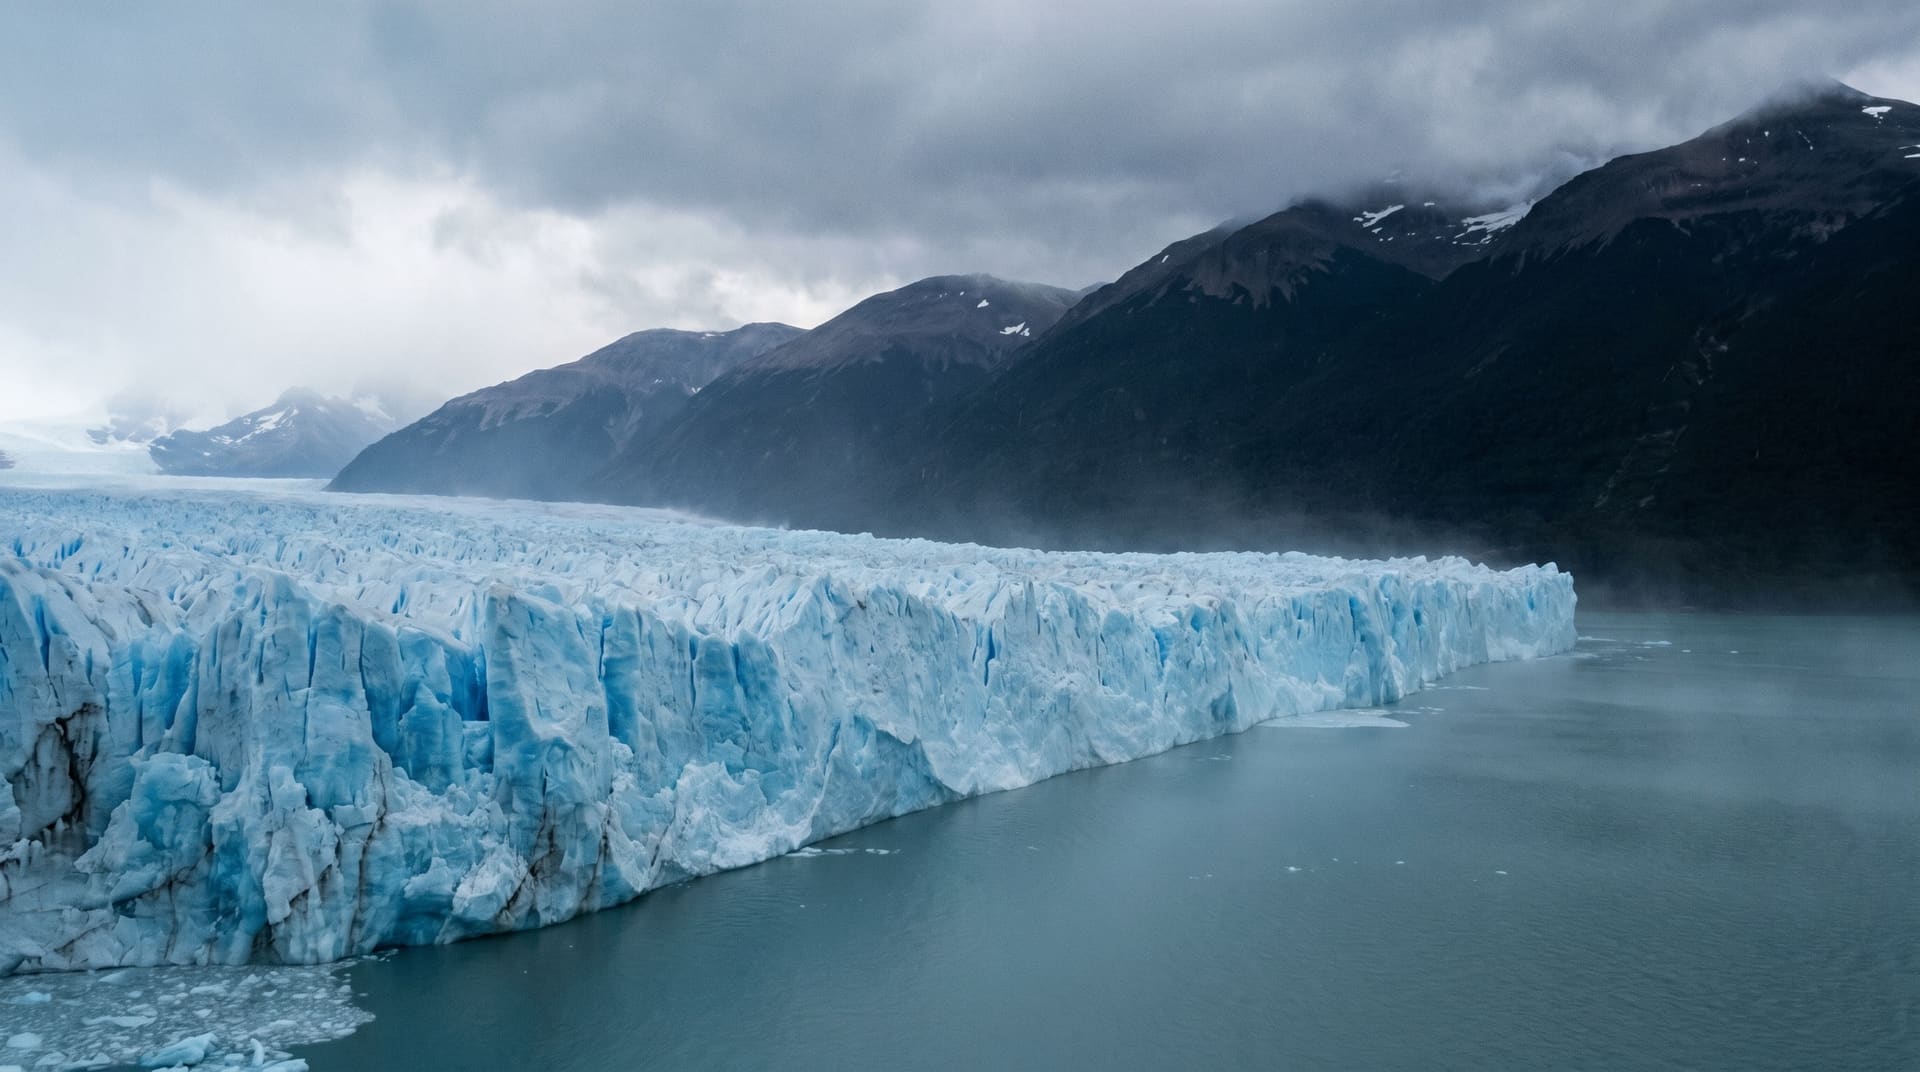 El Calafate, argentina1 µg/m³·~$957~$95740mb3°C6.3 nomad1µg/m³
 - 02
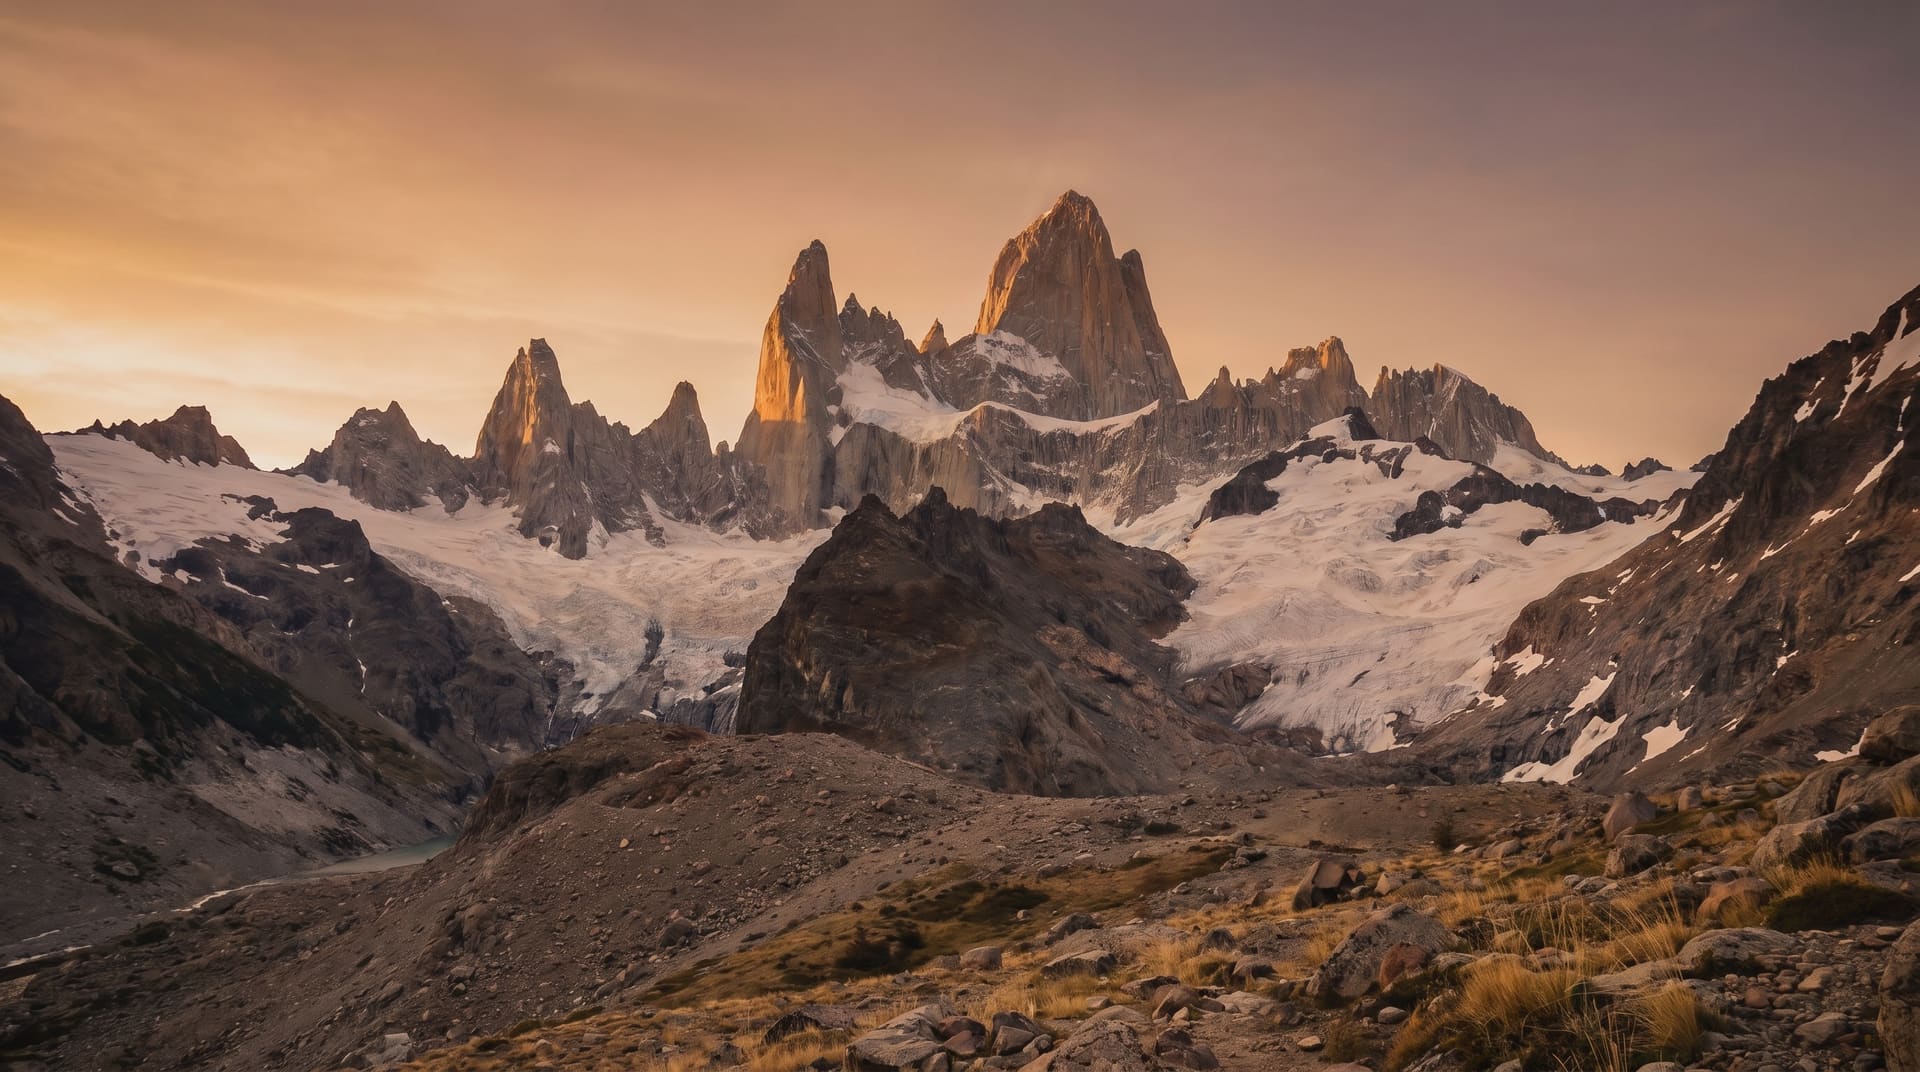 El Chalten, argentina1 µg/m³·~$957~$95740mb-5°C6.2 nomad1µg/m³
 - 03
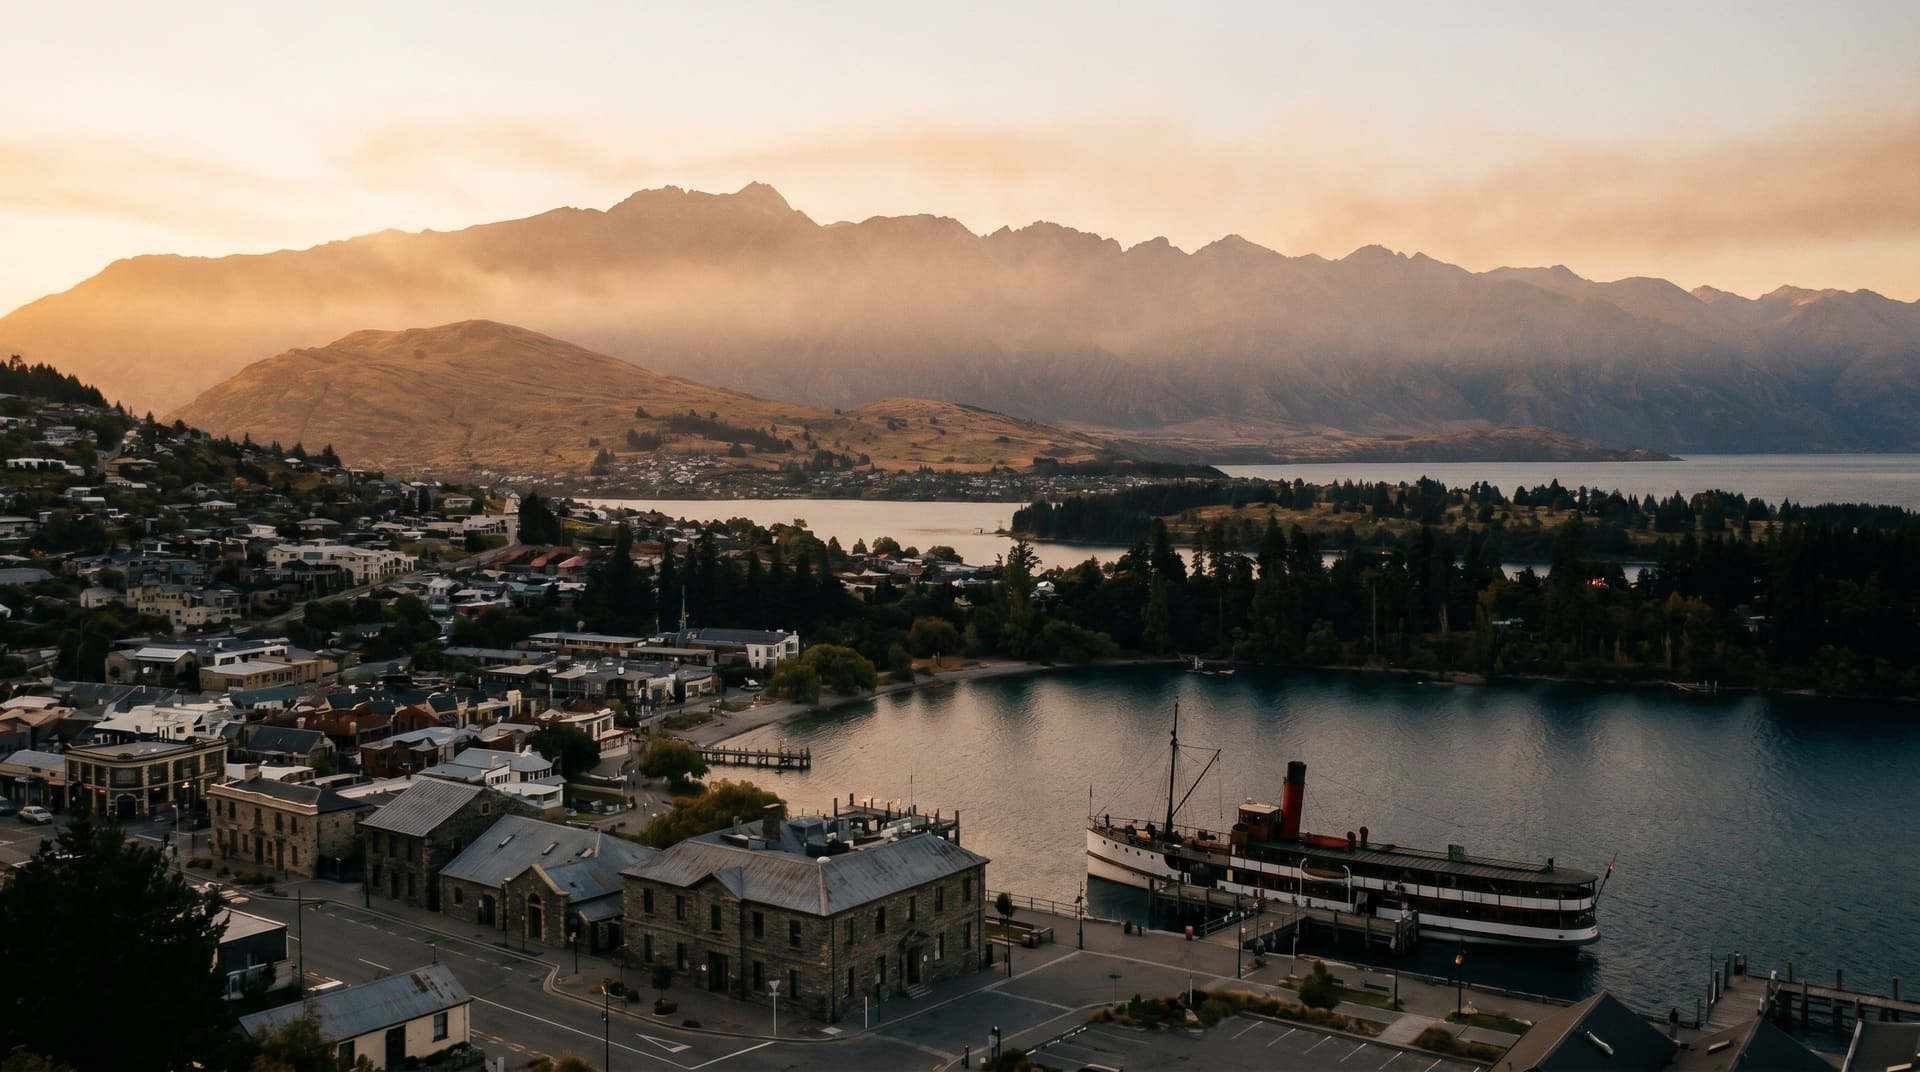 Queenstown, new zealand2 µg/m³·$2,759$2,759200mb4°C6.9 nomad2µg/m³
 - 04
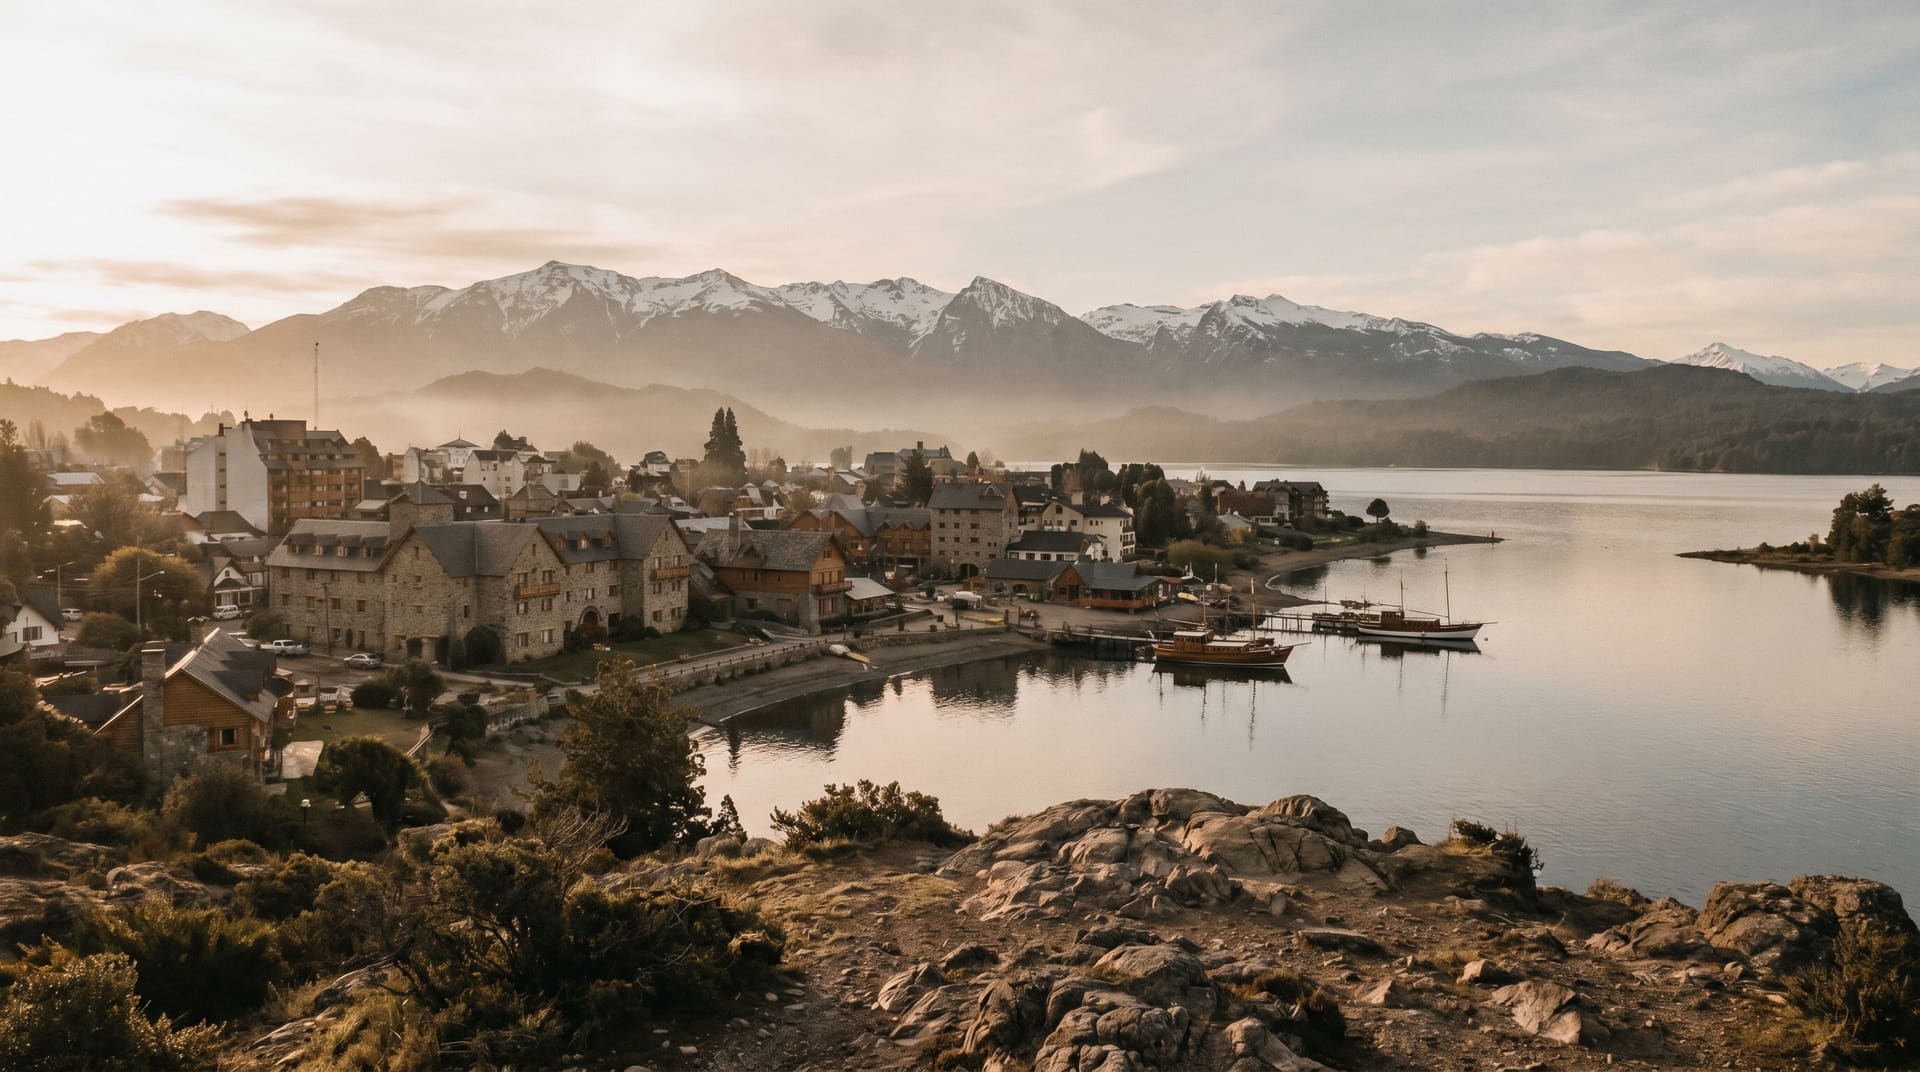 Bariloche, argentina2 µg/m³·~$1,186~$1,186100mb3°C6.4 nomad2µg/m³
 - 05
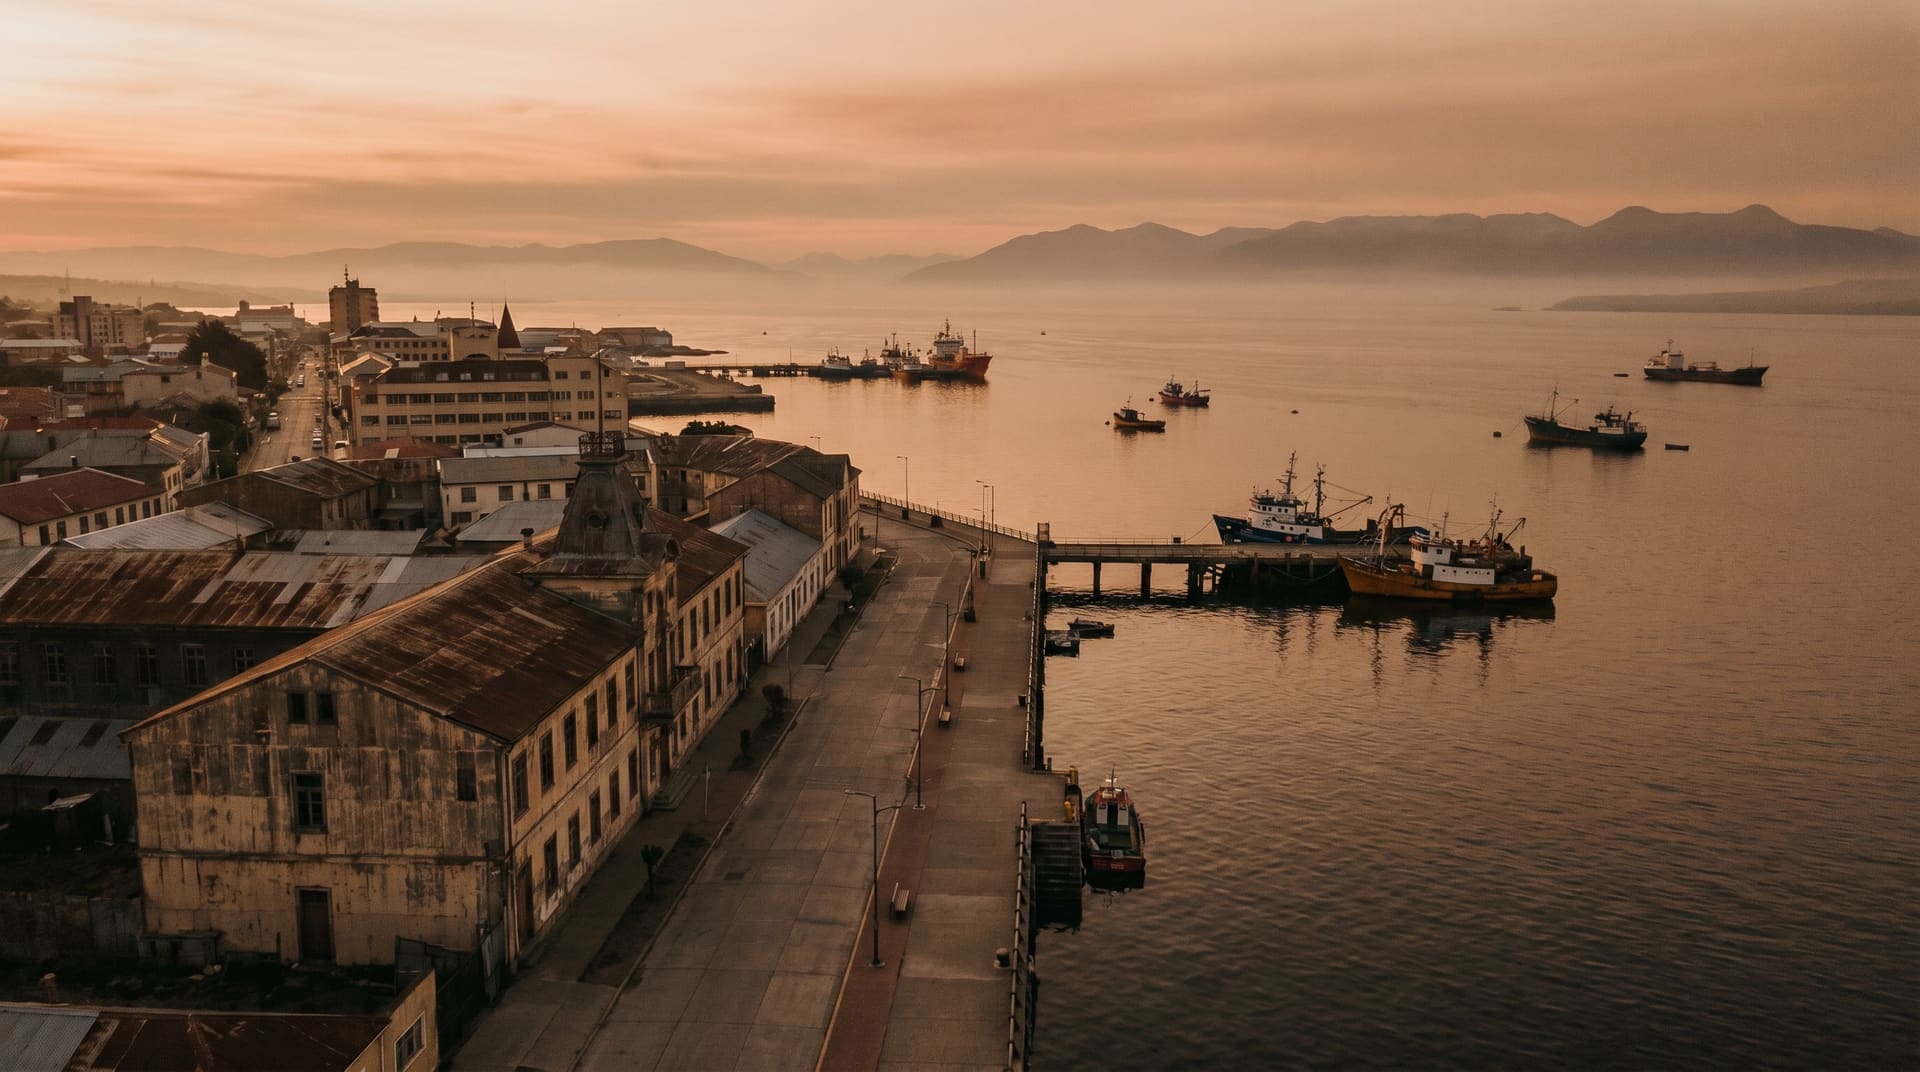 Punta Arenas, chile2 µg/m³·~$1,273~$1,27380mb4°C6.5 nomad2µg/m³
 - 06
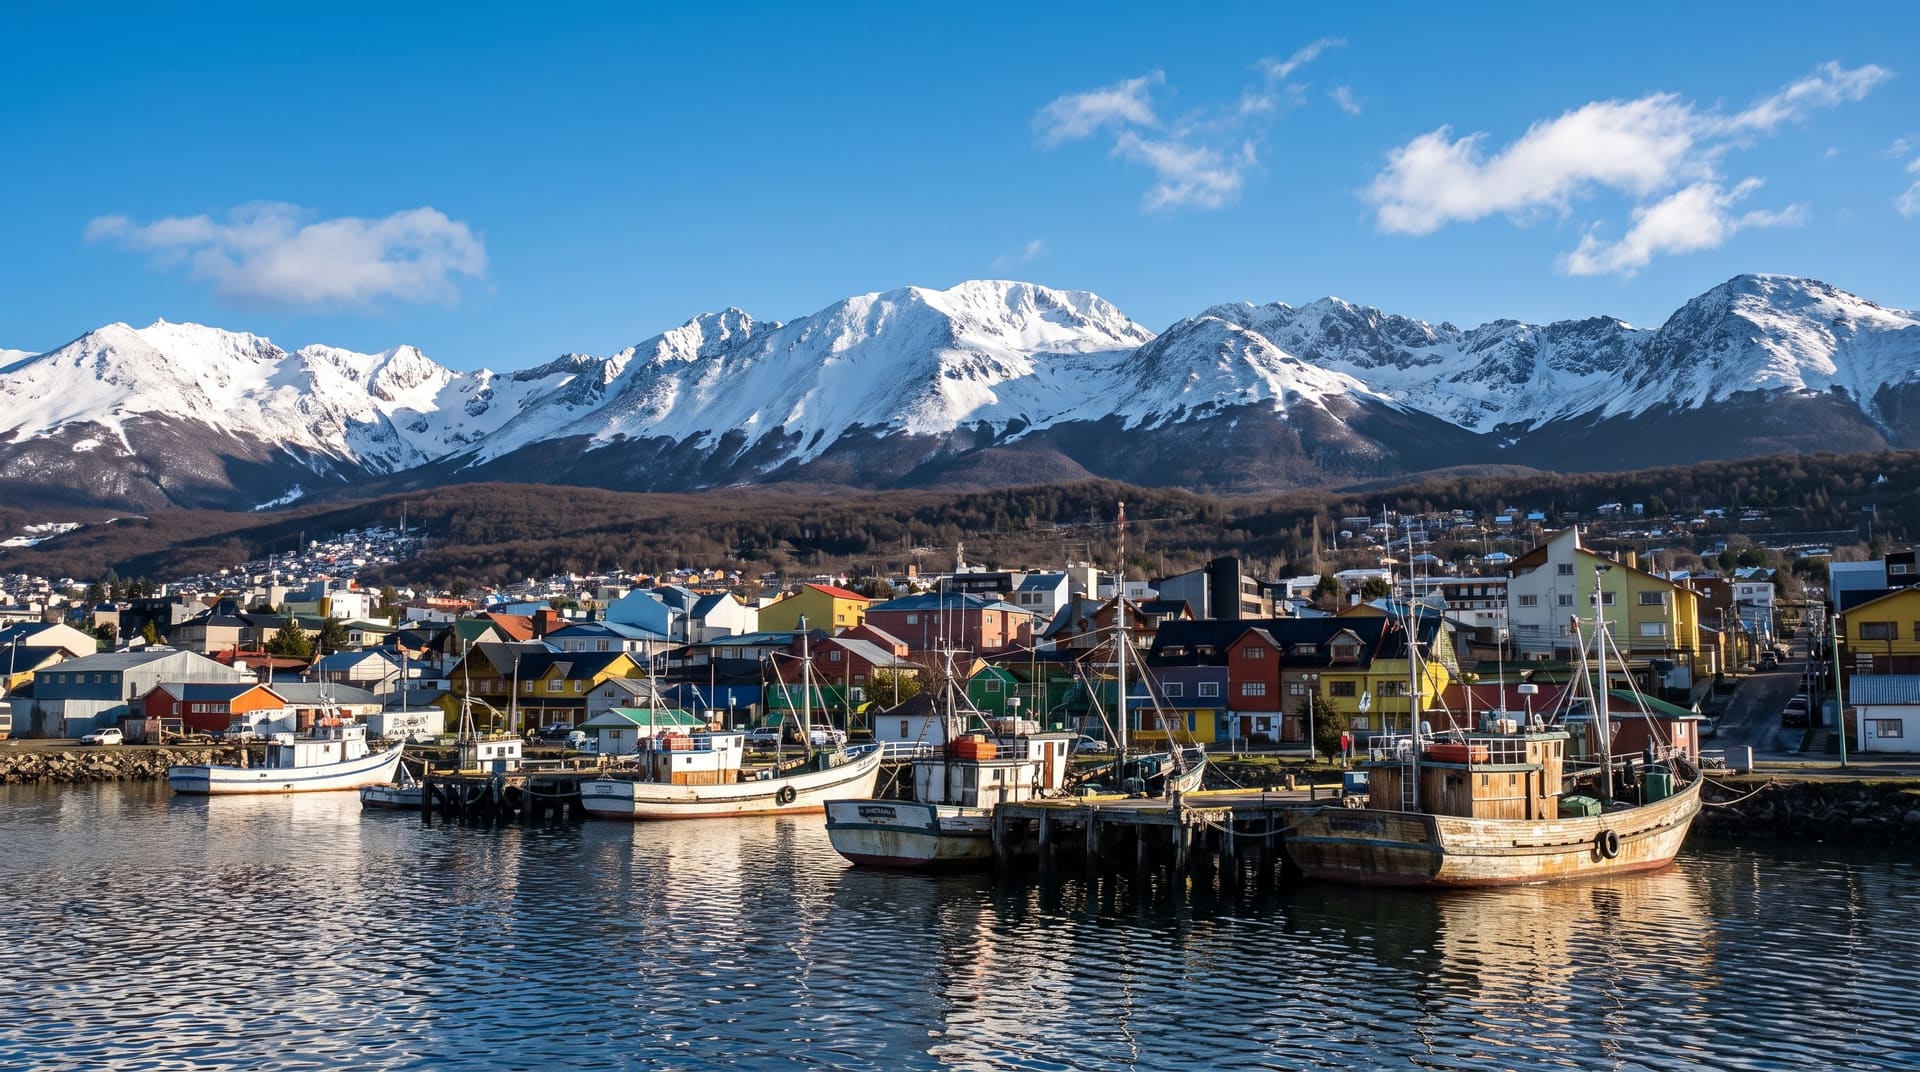 Ushuaia, argentina2 µg/m³·~$957~$95740mb-1°C6.2 nomad2µg/m³
 - 07
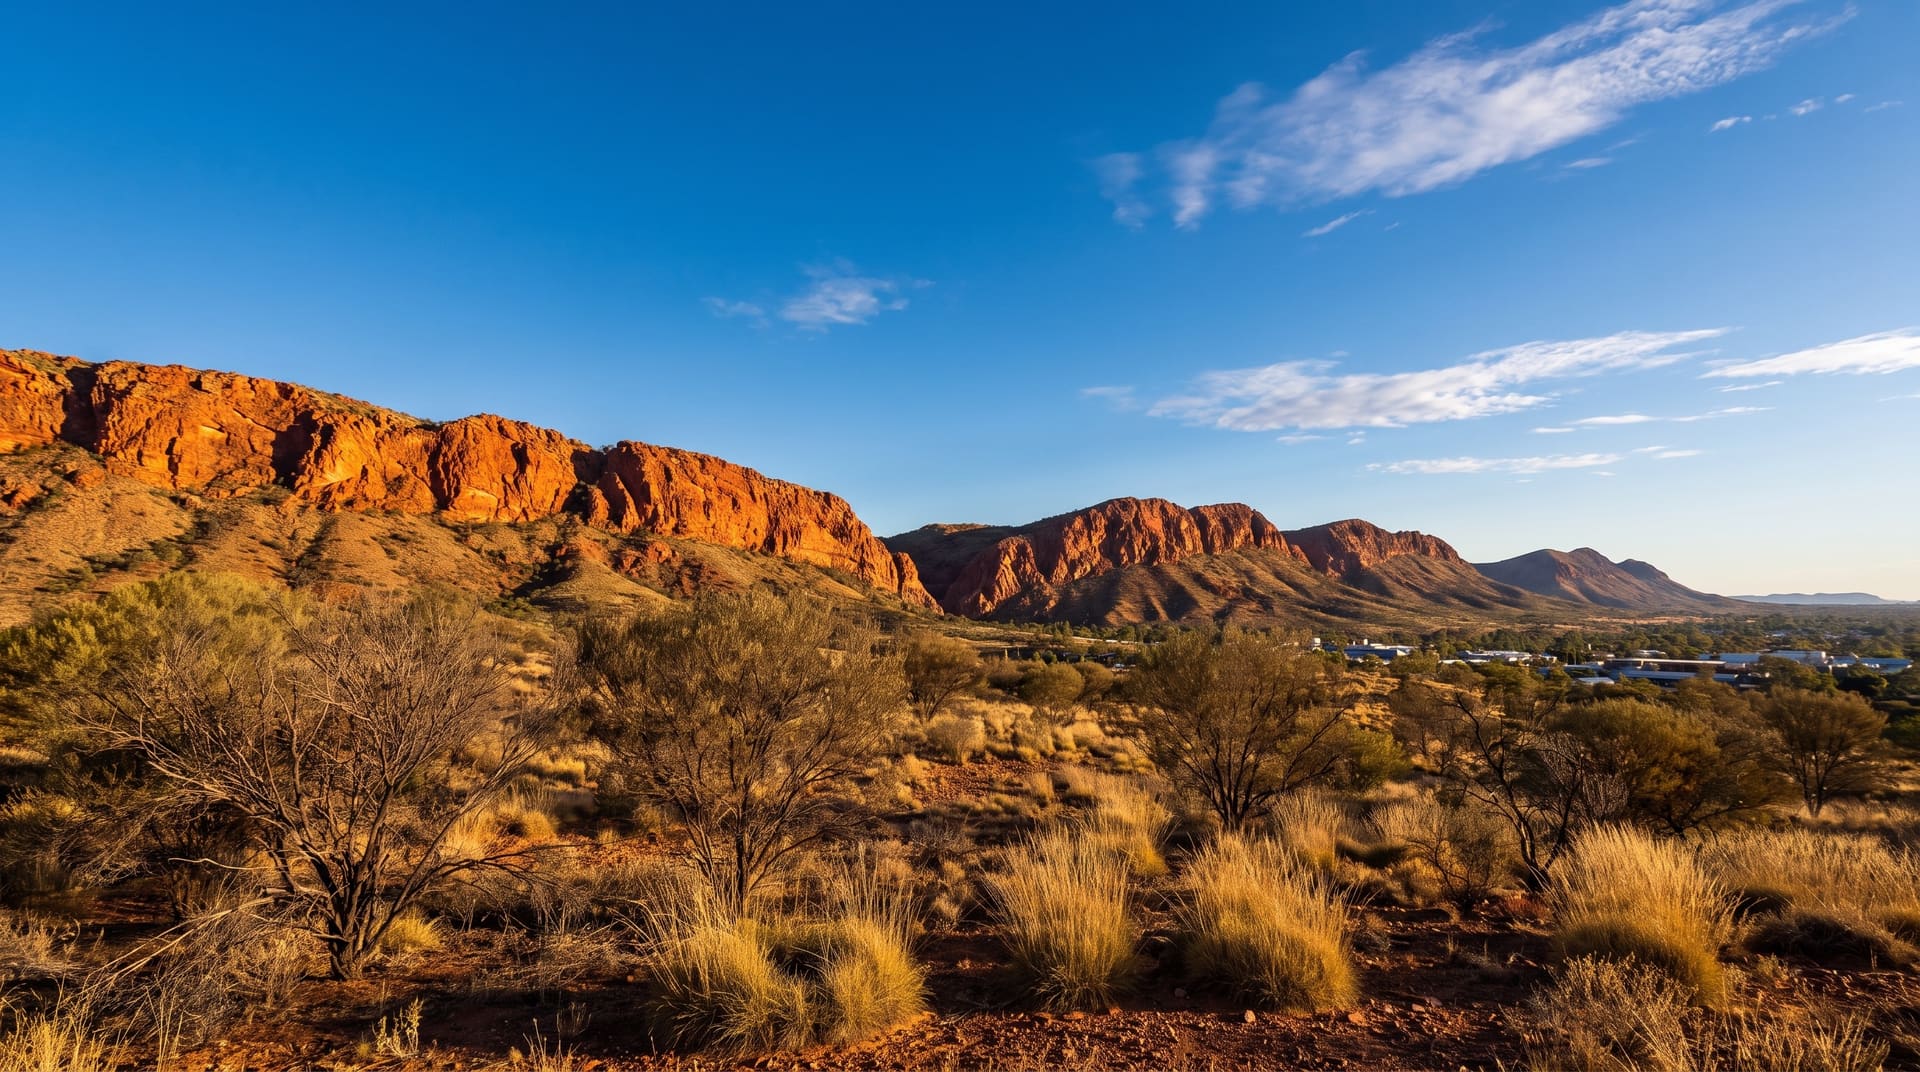 Alice Springs, australia2 µg/m³·~$2,181~$2,181150mb10°C7.1 nomad2µg/m³
 - 08
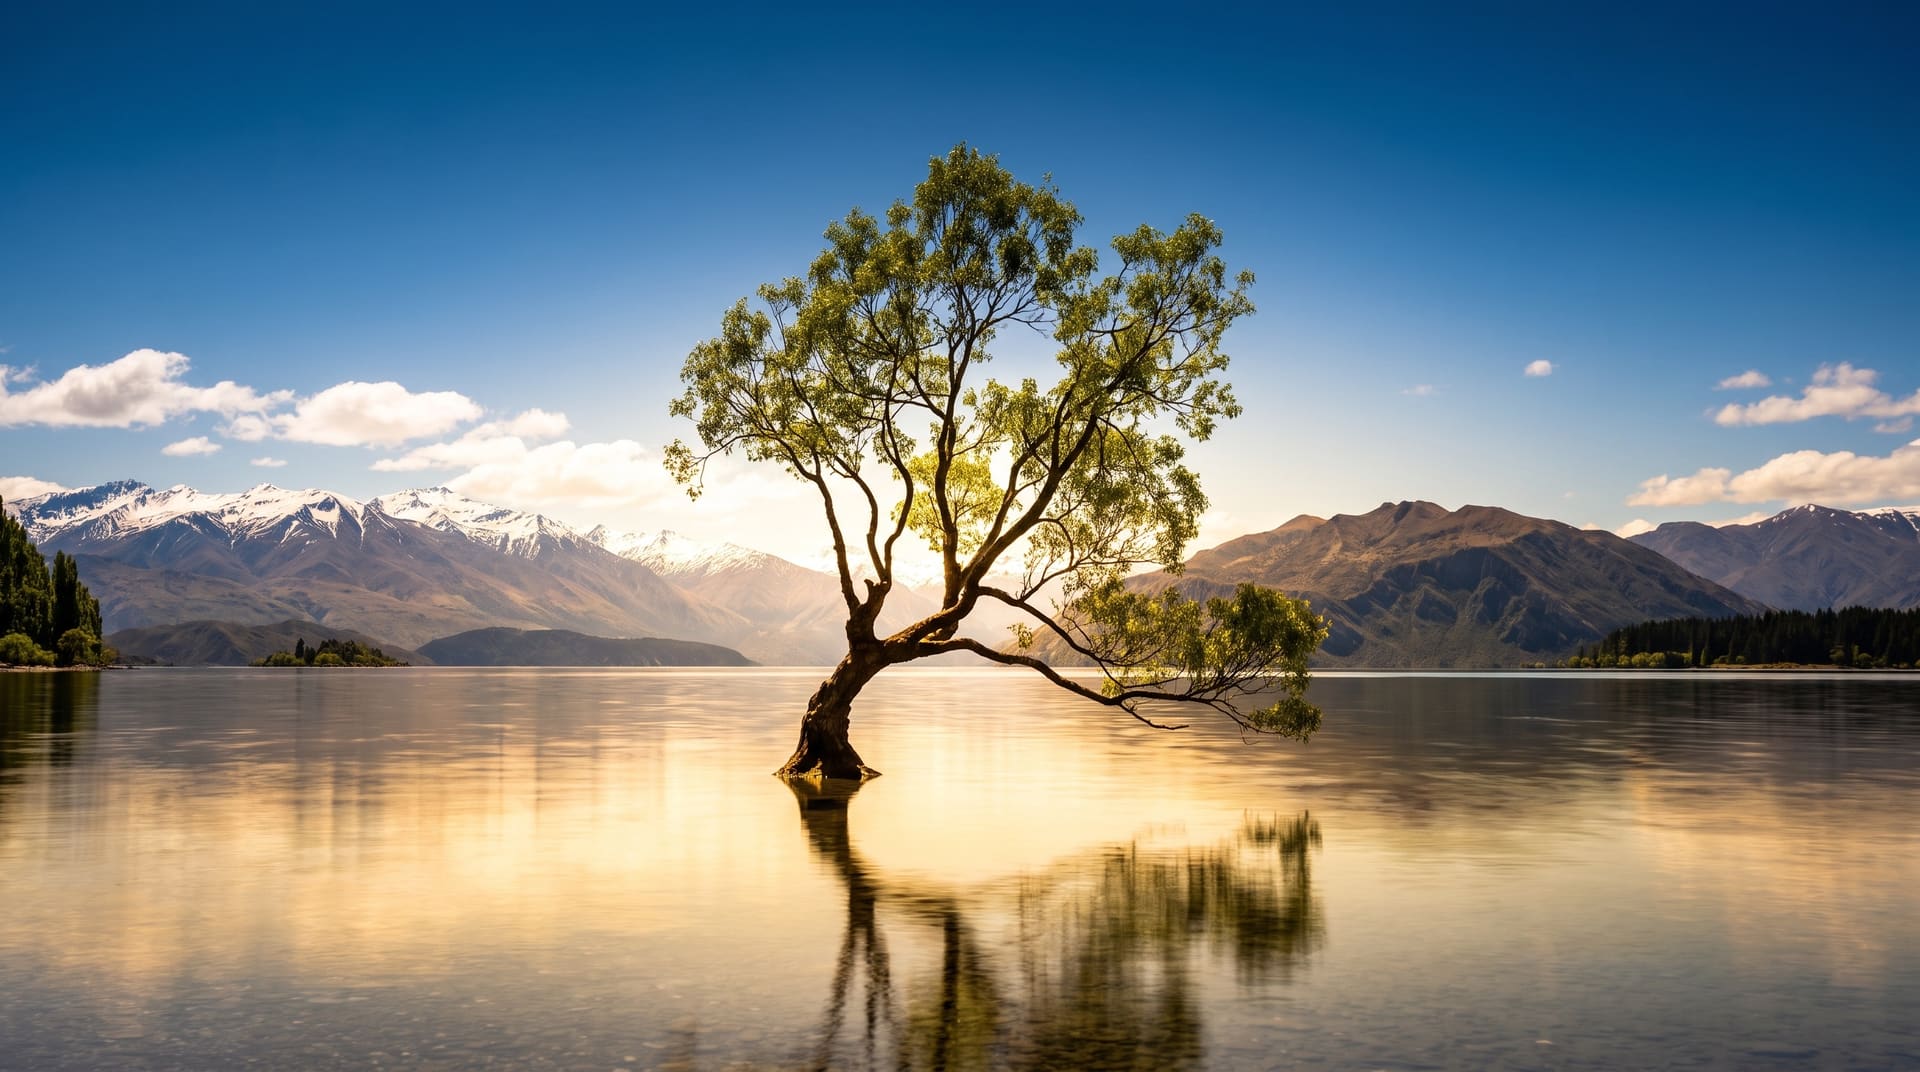 Wanaka, new zealand2 µg/m³·$3,201$3,201130mb3°C6.2 nomad2µg/m³
 - 09
 Svolvaer, norway2 µg/m³·~$2,706~$2,706130mb12°C6.2 nomad2µg/m³
 - 10
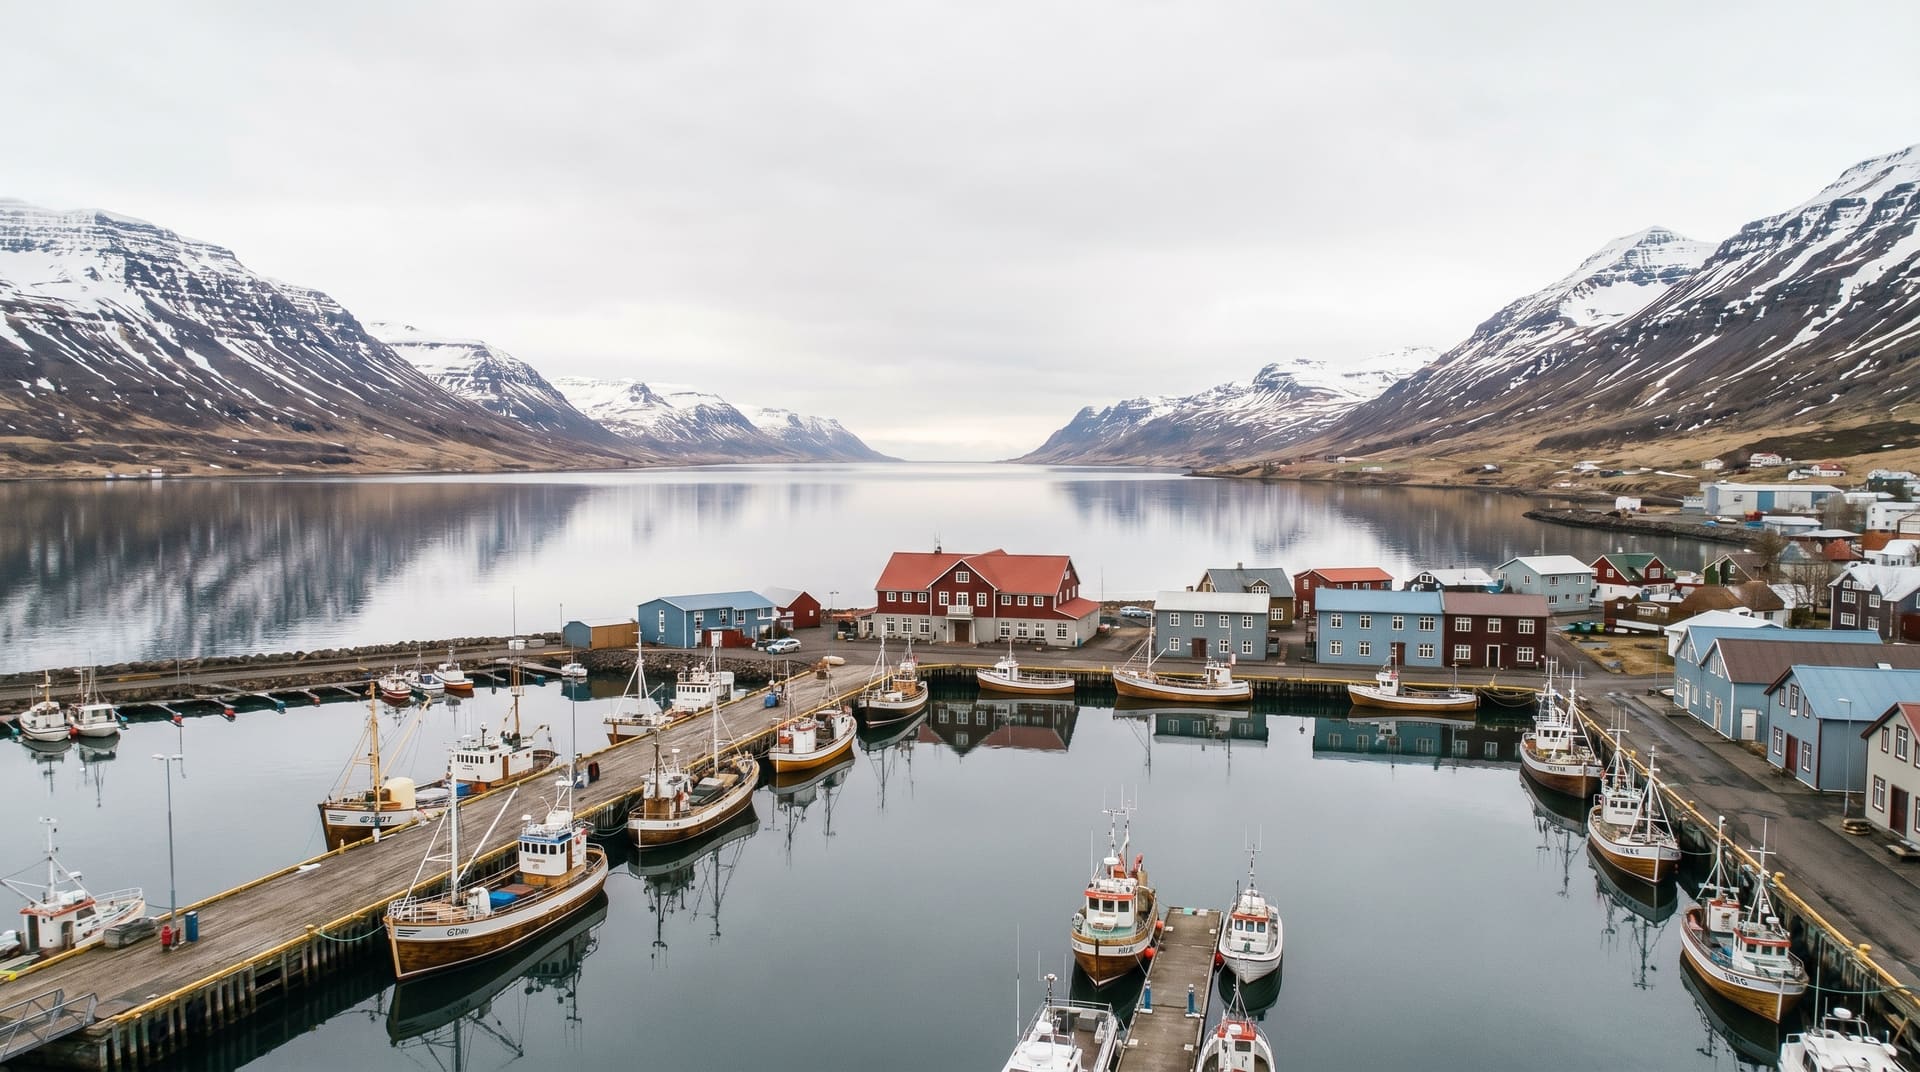 Akureyri, iceland2 µg/m³·~$2,842~$2,842130mb12°C6.5 nomad2µg/m³
 - 11
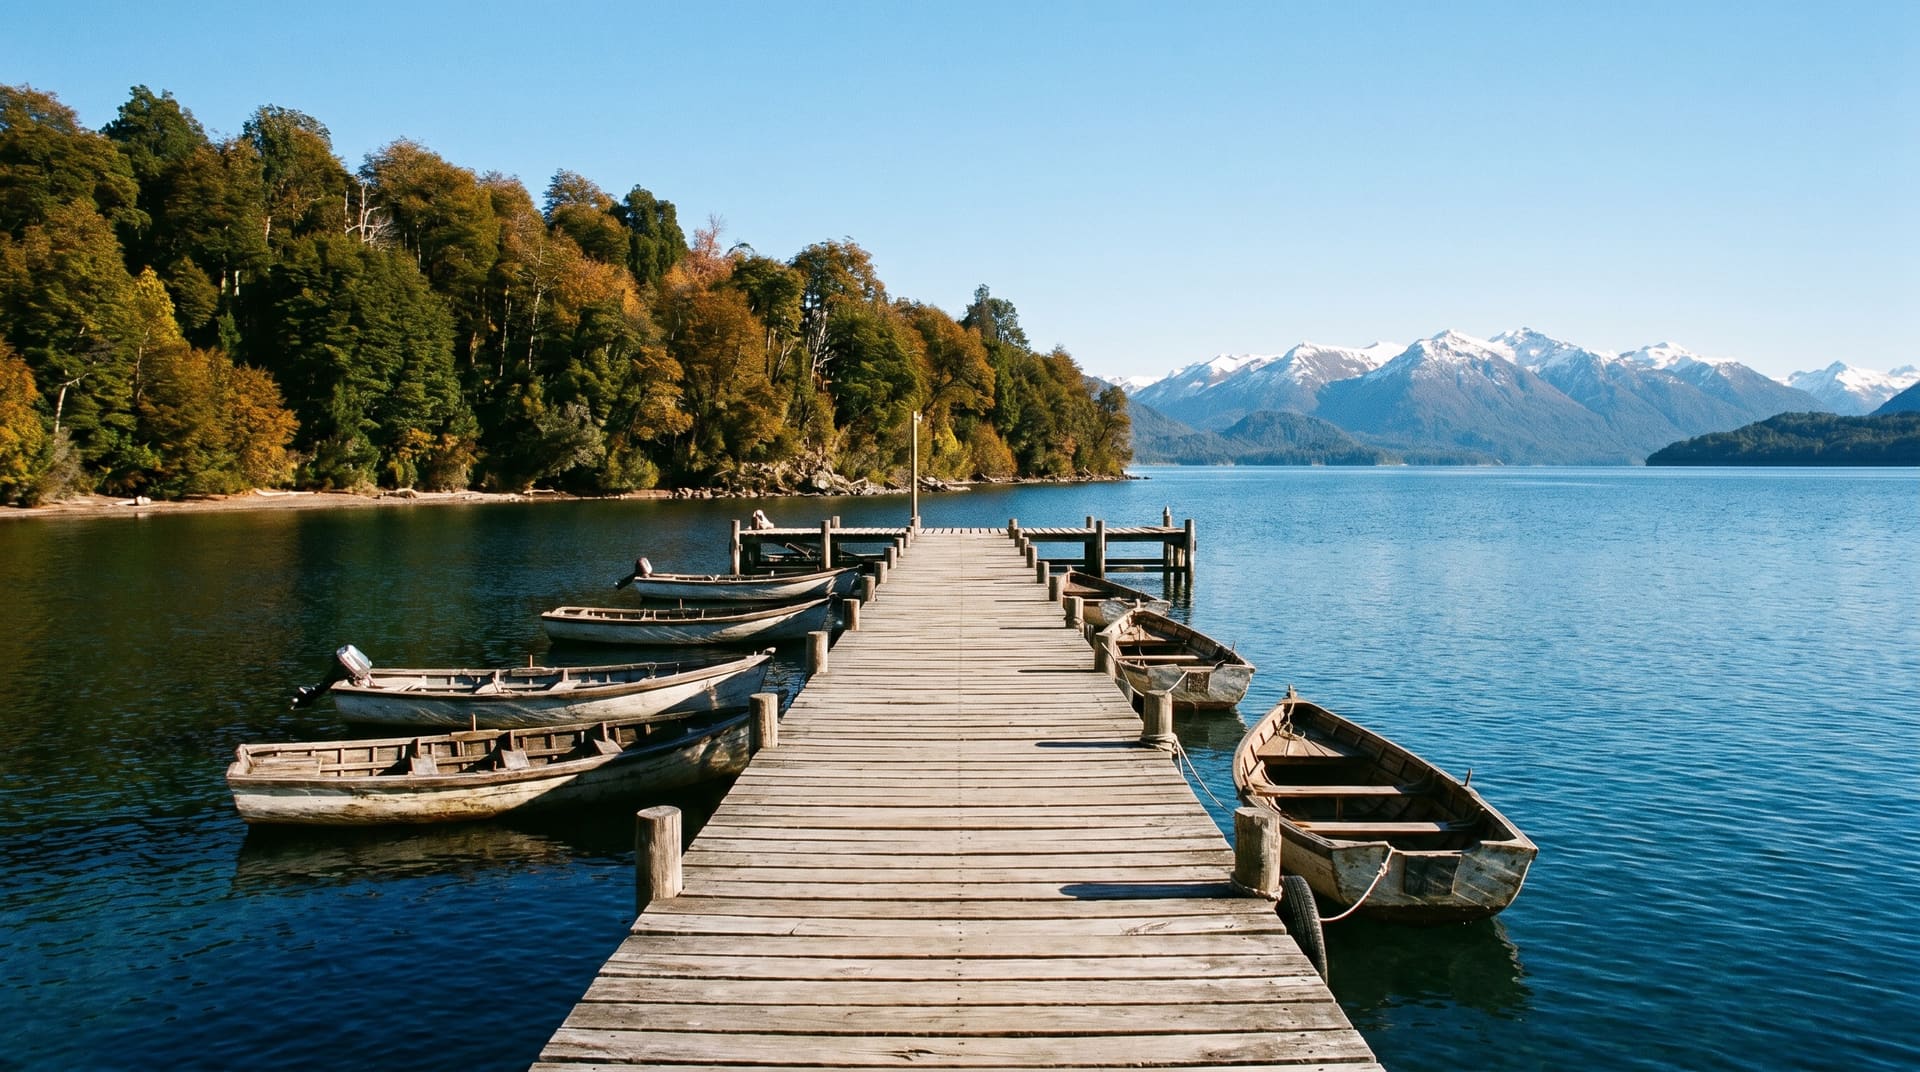 Villa La Angostura, argentina2 µg/m³·~$957~$95740mb3°C6.2 nomad2µg/m³
 - 12
 Puerto Natales, chile2 µg/m³·~$1,134~$1,13490mb-2°C6.7 nomad2µg/m³
 - 13
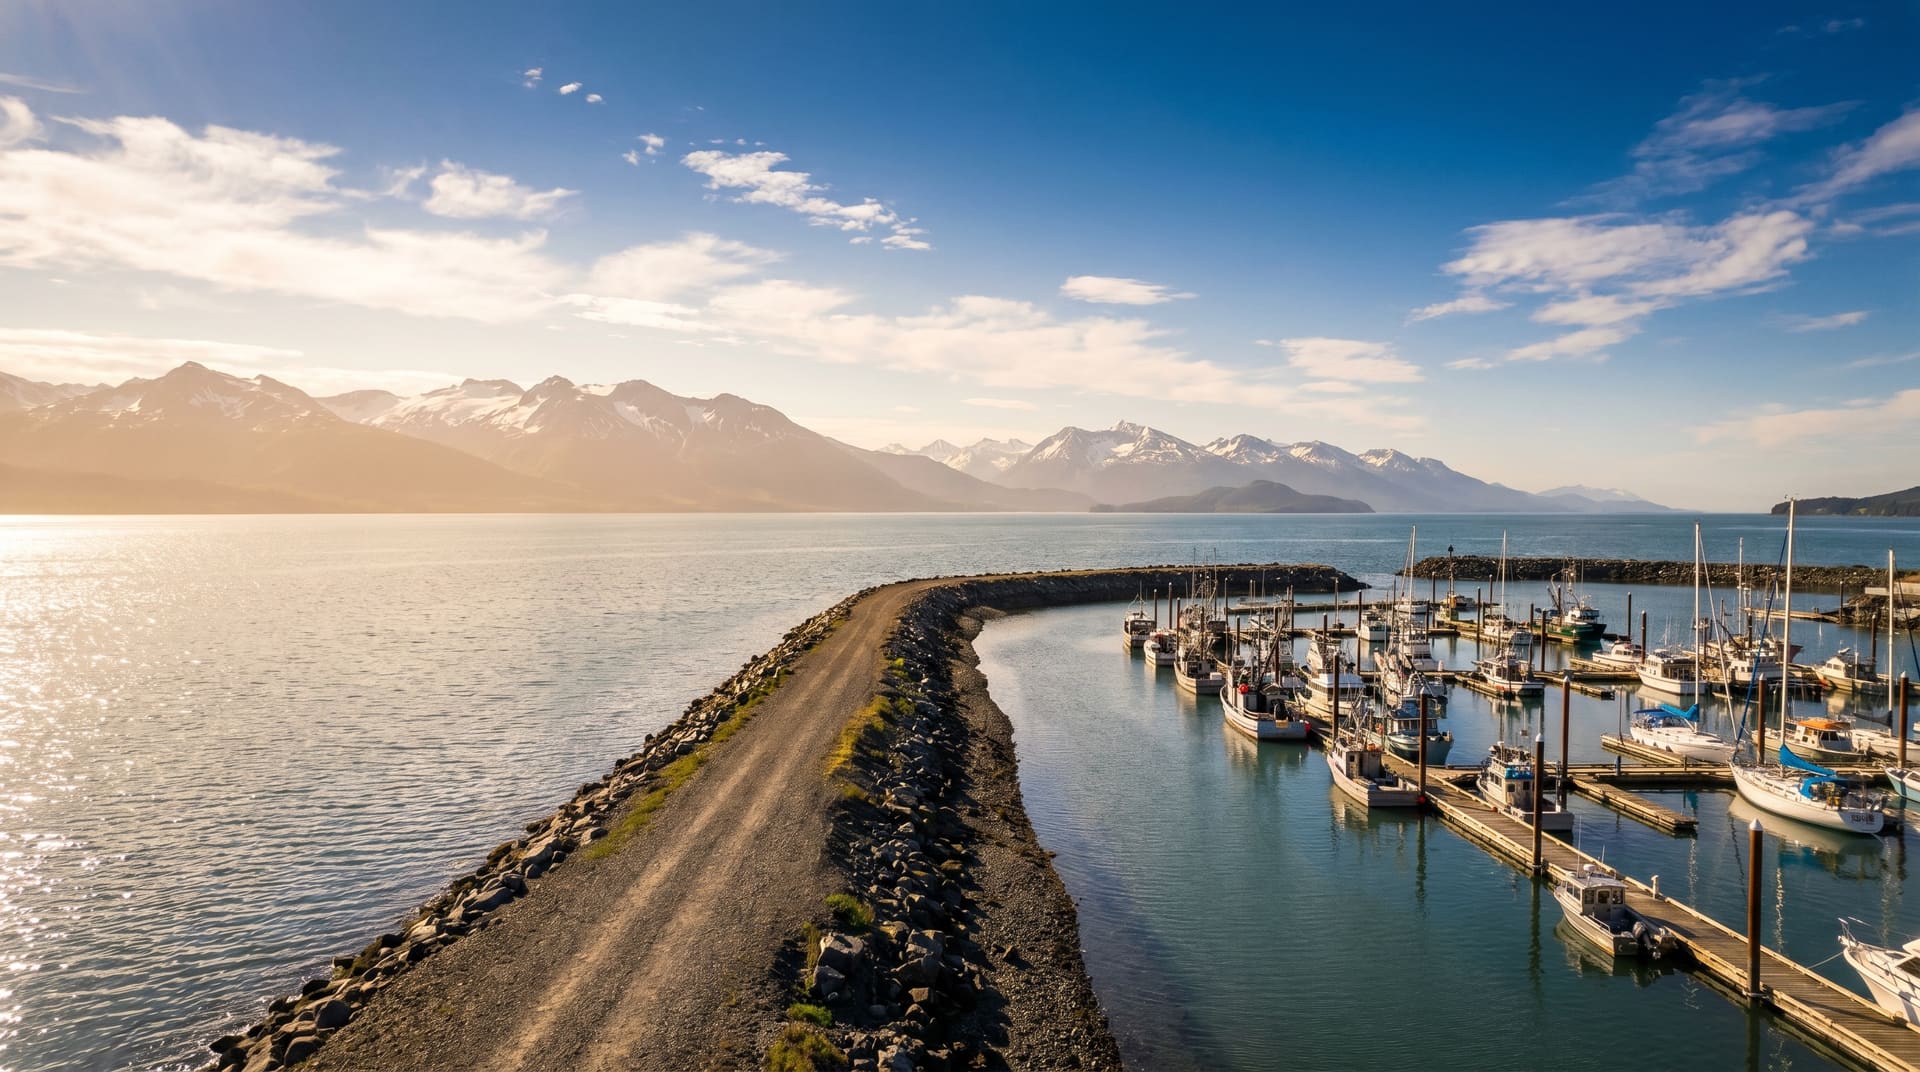 Homer, united states2 µg/m³·$1,730$1,730200mb12°C6.5 nomad2µg/m³
 - 14
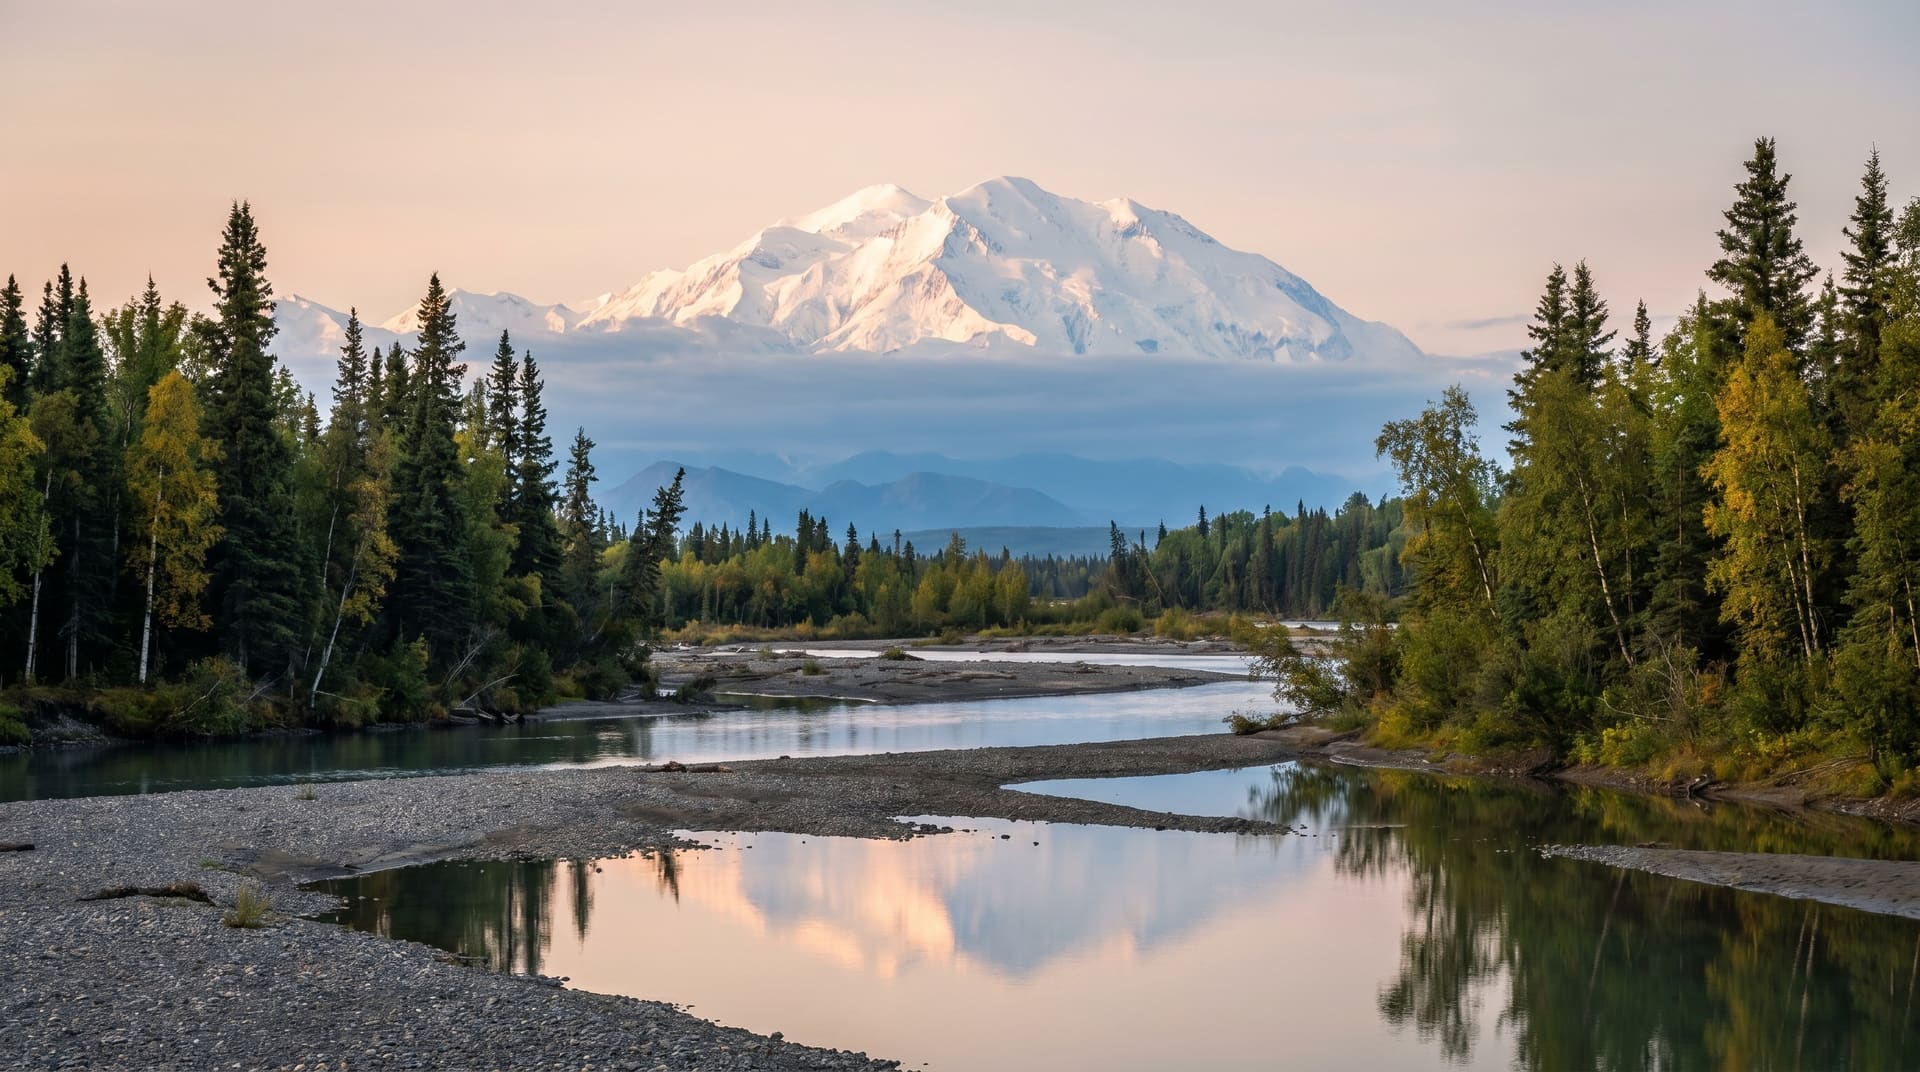 Talkeetna, united states2 µg/m³·$1,704$1,704200mb16°C6.5 nomad2µg/m³
 - 15
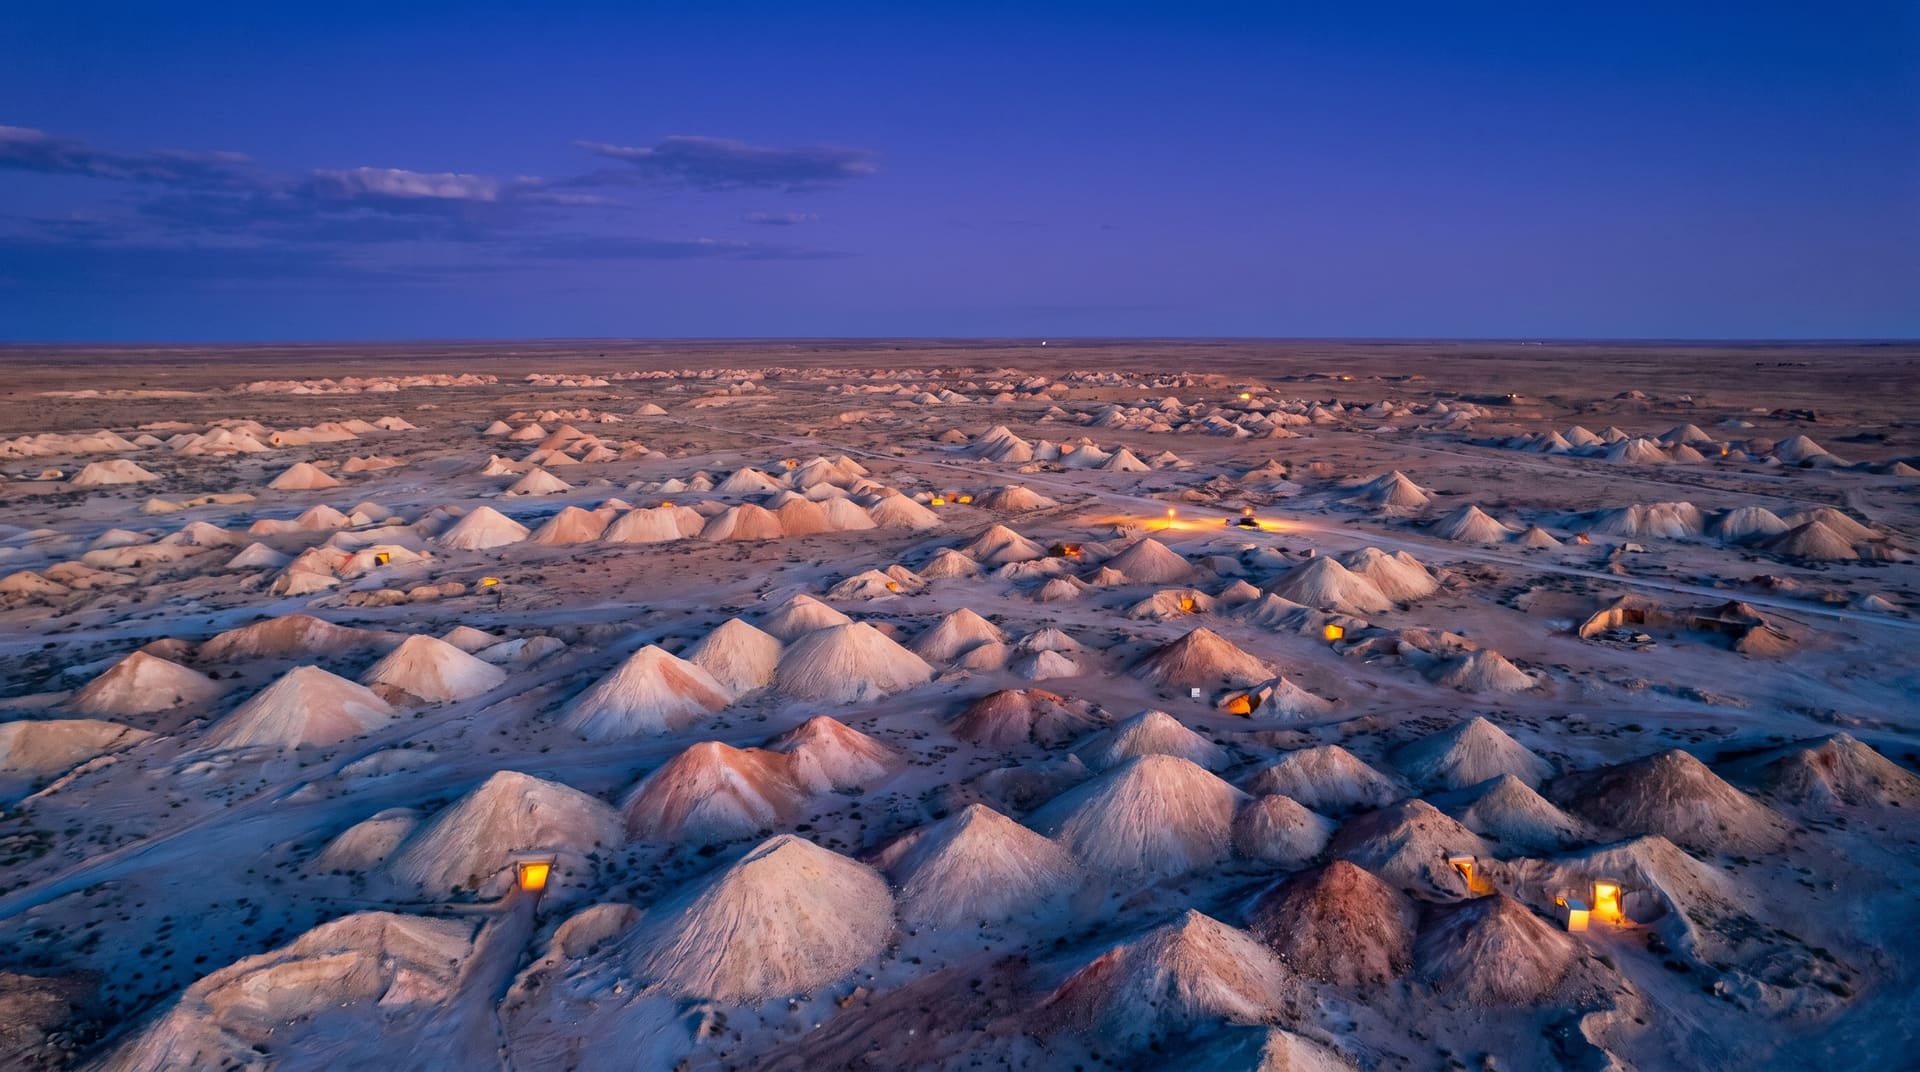 Coober Pedy, australia2 µg/m³·~$2,181~$2,181150mb10°C7.1 nomad2µg/m³
frequently asked
Quick answers.
- Where does this air-quality data come from?
- The ranking uses hourly modelled PM2.5 aggregated into an annual city-level signal. It is not a local station reading.
- Why is PM2.5 the metric here?
- PM2.5 (fine particulates under 2.5 µm) penetrates deep into lung tissue and is the single best-correlated air-quality measure with long-term health outcomes. The WHO 2021 guideline lowered the annual safe limit to 5 µg/m³.
- Does the ranking change seasonally?
- Yes, that's the point of showing 12 monthly means rather than one annual number. Chiang Mai is clean nine months of the year but spikes 40-55 µg/m³ in Feb-April burning season. Each city's detail page shows the 12-month curve.